Heisenberg111
Local Club Regular
- Joined
- Oct 31, 2017
- Runs
- 1,483
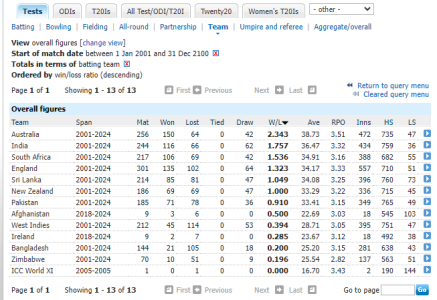
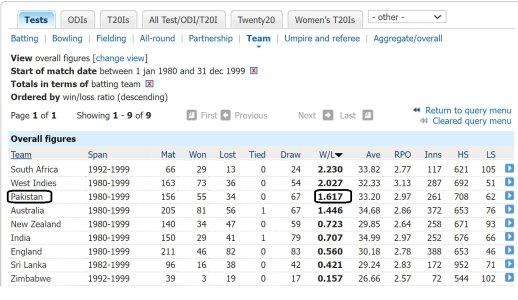
I was just checking the W/L records of different teams at home in test cricket in the last 20 years. The W/L ratios of teams are as follows.
1. India ( W/L ratio of 5.18)
2. Australia ( W/L ratio of 4.88)
3. Pakistan ( W/L ratio of 3.4)
4. England ( W/L ratio of 2.52)
5. New Zealand ( W/L ratio of 2.28)
6. South Africa ( W/L ratio of 2.22)
7. Sri Lanka ( W/L ratio of 1.814)
8. West Indies ( W/L ratio 0.63)
9. Zimbabwe ( W/L ratio of 0.304)
10. Bangladesh ( W/L ratio of 0.243)
https://stats.espncricinfo.com/ci/e...2001;spanval1=span;template=results;type=team
India and Australia lead the pack followed by Pakistan, England and South Africa.


