CricketingMinds
Tape Ball Star
- Joined
- Jan 26, 2012
- Runs
- 730
- Post of the Week
- 1
In my previous post I analyzed Pakistani batsmen's performance in the recently concluded ODI series vs the Windies in WI.
Even though Pakistan emerged as the champions, winning 2-1, against a weakened WI bowling line up, there were lots of Lessons Learnt for the Men in Green as pointed out in my post:
http://www.pakpassion.net/ppforum/s...atsmen-vs-West-Indies-(ODI-Series-2017-April)
However, as any good analysis, it is always important to BENCHMARK your numbers against "others". Thus, in this case, I have benchmarked the performance of Pakistani batsmen to the performance of Indian Batsmen in their previous visit of the Caribbean (in 2013 - Tri-Series [Ind v Sl v WI]).
I do acknowledge the fact that this might not be the most fair comparison, since the two series are 3.5 years apart. BUT, this is the fairest comparison I could get in terms of:
- Opposition
- Pitches
- Conditions
Interestingly, if you remember this series, India and SL played the final and India won by 1 Wicket.
http://www.espncricinfo.com/tri-nation-west-indies-2013/content/series/597920.html
Anyway, lets get to the analysis.
Pakistan Batsmen Performance

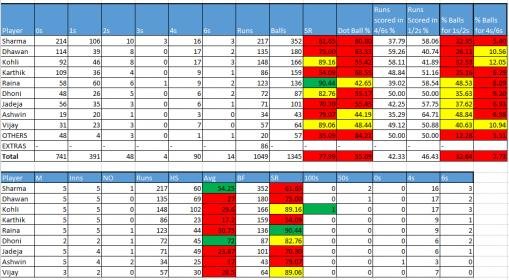
Indian Batsmen Performance

Let me once again remind the readers about the metrics and criteria being used here to dissect Pakistani & Indian Batsmen's performance.
1) Dot Ball % - A very important metric in today's LOI cricket. This is the % dot-balls played by the batsman
RED = 50% or more Dot-Balls
YELLOW = 40-50% Dot Balls
GREEN = Below 40% Dot Balls.
2) % Balls for 1s/2s - This is calculated using the formula
(Number of balls played for 1s or 2s) / Total Number of Balls Played.
This metric tells you the ability of the batsman to Rotate Strike and keep the scoreboard ticking.
RED = Under 35%
YELLOW = 35% to 50%
GREEN = Above 50%.
A good rotator of the strike should be able to pick gaps and run for 1s/2s consistently (> 50% of balls played).
3) % Balls for 4s/6s - This is calculated using the formula
(Number for 4s & 6s)/Total Number of Balls Played.
Strong teams and batsmen have this number ~ 15%+
RED = Less than 10%
YELLOW = 10% - 15%
GREEN = 15% and Above -
First Impression
You would naturally expect Indian star batting line-up to out perform Pakistan, right?
I thought so too. But looking at the numbers & colors, you immediately notice more GREEN boxes in Pakistan than India. You also notice more RED boxes in India than Pakistan. So strange right?
Strike Rotation
Dot Ball %:
Both in the Red:
Pak = 50.36%
Ind = 55.09 %
Surprisingly Pakistan doing slightly better.
% Balls for 1s/2s
Pak = 39.66% (YELLOW)
Ind = 32.64% (RED)
Again, surprisingly Pakistan doing better.
However, argument can be made that this was the OLD India - now the Indian batsmen are far more superior to their 2013/2014 version. Yes, thats true. But this is the best comparison that I could make. India recently visited WI but they didn't play any ODIs.
Overall SR
Pakistan scored at a SR of 100.49 vs India's 77.99.
Power Hitting
% of balls for 4s/6s
Pakistan = 9.37% (RED)
India = 7.73% (RED).
% Runs scored in 4s/6s
Almost the same - Pak 41.16%; India - 42.33%
=============================
Player Analysis
Even though Sharma scored the most runs for India, he scored them at a very low SR of 61.65 - worse than Shahzad.
In fact, all of India's top order is in the RED Zone for DOT BALL % - including Kohli.
Raina was the only exception who had a decent SR (90.44) and Dot Ball % of 42.65%.
King of Centuries - Kohli - was the only Indian to score a 100 on the tour. No surprises there!
But Kohli had a pretty ordinary time in this series by his standards - (148 runs, @ 29.6 avg, decent SR of almost 90). But his dotball % was high - 55.42%.
It shows that even Kohli struggled on the WI pitches and conditions.
Dhawan
Like Akmal, Dhawan had a forgettable series with poor stats -
135 runs, at 27 avg, Poor SR (75) and poor Dot Ball % (63.33%).
Karthik
The guy consumed 109 dot balls out of the 159 he faced! The highest dotball % - 68.55%
This is as bad as Akmal and Shahzad. No wonder he is no where close to the current Indian XI
Raina
Decent series for him. Couple of yellows and greens there.
SR 90+
Low dot Ball % - 42.65
But lack of runs and poor avg hurt his over all stats.
Dhoni
He played just two games and was able to maintain a high avg of 72.
But surprisingly for a player like Dhoni who is known for running hard and great at strike rotation, he scored only 35% of the runs in 1s/2s and had a high dot ball % of 55.17%
Vijay
He played just the 3 games out of 5 (He was Dhoni's replacement). Not sure why Indian Management picked Karthik for all 5 games whereas Vijay outperformed Karthik.
Vijay is the only batsman with no REDs. All YELLOWs
- SR = 89
- Dot Ball % = 48.44% (Just under 50%)
- % balls for 1s/2s = 40%+
- % balls for 4s/6s = 10.94%
===============================
Conclusion
Bottomline - At least in the WI vs similar attacks - Pakistani batsmen especially Babar, Hafeez, Malik, Sarfaraz and Imad outperformed Indian counterparts in terms of both: Power-Hitting and Strike Rotation
This makes me realize that perhaps its not just our batsmen but the nature of the pitches and conditions in WI, that lead to low scores.
So our men in green didn't do AS BAD as it may seem initially without any benchmark.
In my next edition, I will try to compare the stats of Indian Batsmen v Pakistani Batsmen in their latest trip down south (vs AUS in ODI).
If you would like to see any other type of analysis, let me know I will do my best. Throw in your ideas & feedback!")
Thanks!
Even though Pakistan emerged as the champions, winning 2-1, against a weakened WI bowling line up, there were lots of Lessons Learnt for the Men in Green as pointed out in my post:
http://www.pakpassion.net/ppforum/s...atsmen-vs-West-Indies-(ODI-Series-2017-April)
However, as any good analysis, it is always important to BENCHMARK your numbers against "others". Thus, in this case, I have benchmarked the performance of Pakistani batsmen to the performance of Indian Batsmen in their previous visit of the Caribbean (in 2013 - Tri-Series [Ind v Sl v WI]).
I do acknowledge the fact that this might not be the most fair comparison, since the two series are 3.5 years apart. BUT, this is the fairest comparison I could get in terms of:
- Opposition
- Pitches
- Conditions
Interestingly, if you remember this series, India and SL played the final and India won by 1 Wicket.
http://www.espncricinfo.com/tri-nation-west-indies-2013/content/series/597920.html
Anyway, lets get to the analysis.
Pakistan Batsmen Performance
Indian Batsmen Performance
Let me once again remind the readers about the metrics and criteria being used here to dissect Pakistani & Indian Batsmen's performance.
1) Dot Ball % - A very important metric in today's LOI cricket. This is the % dot-balls played by the batsman
RED = 50% or more Dot-Balls
YELLOW = 40-50% Dot Balls
GREEN = Below 40% Dot Balls.
2) % Balls for 1s/2s - This is calculated using the formula
(Number of balls played for 1s or 2s) / Total Number of Balls Played.
This metric tells you the ability of the batsman to Rotate Strike and keep the scoreboard ticking.
RED = Under 35%
YELLOW = 35% to 50%
GREEN = Above 50%.
A good rotator of the strike should be able to pick gaps and run for 1s/2s consistently (> 50% of balls played).
3) % Balls for 4s/6s - This is calculated using the formula
(Number for 4s & 6s)/Total Number of Balls Played.
Strong teams and batsmen have this number ~ 15%+
RED = Less than 10%
YELLOW = 10% - 15%
GREEN = 15% and Above -
First Impression
You would naturally expect Indian star batting line-up to out perform Pakistan, right?
I thought so too. But looking at the numbers & colors, you immediately notice more GREEN boxes in Pakistan than India. You also notice more RED boxes in India than Pakistan. So strange right?
Strike Rotation
Dot Ball %:
Both in the Red:
Pak = 50.36%
Ind = 55.09 %
Surprisingly Pakistan doing slightly better.
% Balls for 1s/2s
Pak = 39.66% (YELLOW)
Ind = 32.64% (RED)
Again, surprisingly Pakistan doing better.
However, argument can be made that this was the OLD India - now the Indian batsmen are far more superior to their 2013/2014 version. Yes, thats true. But this is the best comparison that I could make. India recently visited WI but they didn't play any ODIs.
Overall SR
Pakistan scored at a SR of 100.49 vs India's 77.99.
Power Hitting
% of balls for 4s/6s
Pakistan = 9.37% (RED)
India = 7.73% (RED).
% Runs scored in 4s/6s
Almost the same - Pak 41.16%; India - 42.33%
=============================
Player Analysis
Even though Sharma scored the most runs for India, he scored them at a very low SR of 61.65 - worse than Shahzad.
In fact, all of India's top order is in the RED Zone for DOT BALL % - including Kohli.
Raina was the only exception who had a decent SR (90.44) and Dot Ball % of 42.65%.
King of Centuries - Kohli - was the only Indian to score a 100 on the tour. No surprises there!
But Kohli had a pretty ordinary time in this series by his standards - (148 runs, @ 29.6 avg, decent SR of almost 90). But his dotball % was high - 55.42%.
It shows that even Kohli struggled on the WI pitches and conditions.
Dhawan
Like Akmal, Dhawan had a forgettable series with poor stats -
135 runs, at 27 avg, Poor SR (75) and poor Dot Ball % (63.33%).
Karthik
The guy consumed 109 dot balls out of the 159 he faced! The highest dotball % - 68.55%
This is as bad as Akmal and Shahzad. No wonder he is no where close to the current Indian XI
Raina
Decent series for him. Couple of yellows and greens there.
SR 90+
Low dot Ball % - 42.65
But lack of runs and poor avg hurt his over all stats.
Dhoni
He played just two games and was able to maintain a high avg of 72.
But surprisingly for a player like Dhoni who is known for running hard and great at strike rotation, he scored only 35% of the runs in 1s/2s and had a high dot ball % of 55.17%
Vijay
He played just the 3 games out of 5 (He was Dhoni's replacement). Not sure why Indian Management picked Karthik for all 5 games whereas Vijay outperformed Karthik.
Vijay is the only batsman with no REDs. All YELLOWs
- SR = 89
- Dot Ball % = 48.44% (Just under 50%)
- % balls for 1s/2s = 40%+
- % balls for 4s/6s = 10.94%
===============================
Conclusion
Bottomline - At least in the WI vs similar attacks - Pakistani batsmen especially Babar, Hafeez, Malik, Sarfaraz and Imad outperformed Indian counterparts in terms of both: Power-Hitting and Strike Rotation
This makes me realize that perhaps its not just our batsmen but the nature of the pitches and conditions in WI, that lead to low scores.
So our men in green didn't do AS BAD as it may seem initially without any benchmark.
In my next edition, I will try to compare the stats of Indian Batsmen v Pakistani Batsmen in their latest trip down south (vs AUS in ODI).
If you would like to see any other type of analysis, let me know I will do my best. Throw in your ideas & feedback!
Thanks!