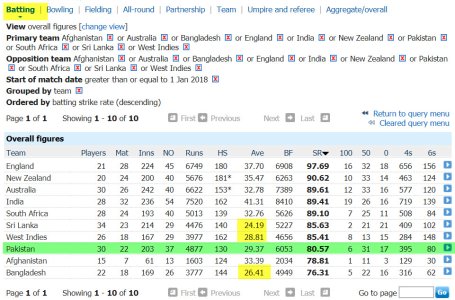
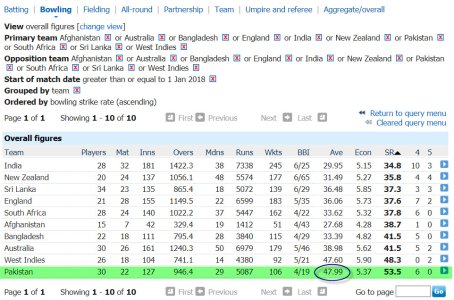
I think, giving individual game as an example could be risky for any such data. Take the CT Final - no analysis can justify that result. Similarly, opposite is also applicable - this time again that CT Final and for IND. Over a significant number of games (I think, statistical significance is randomly picked 30), we can see a trend that's indicative - can give a reflection of relative stands of the teams.
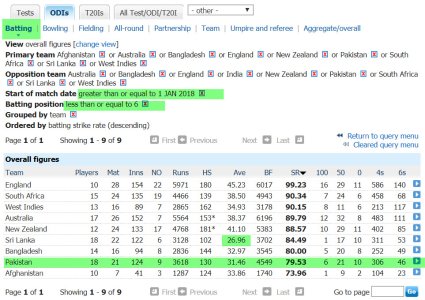
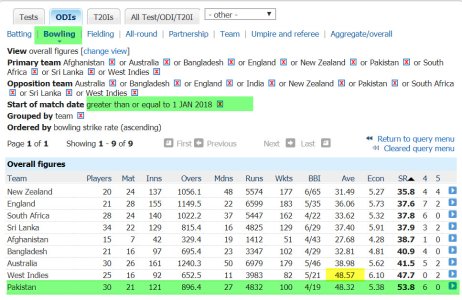
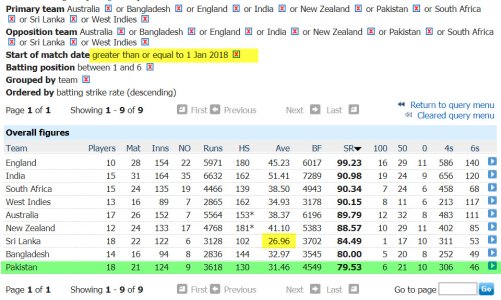
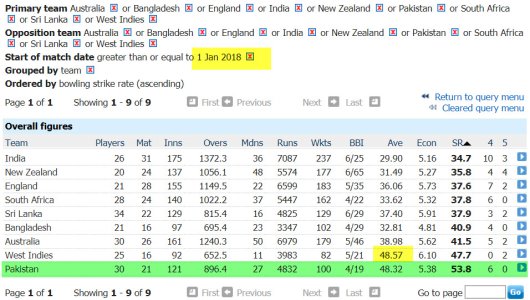
Coming to the two elements, indeed for a game limited by overs, scoring rate, average, economy & strike rate are the key elements (bowling SR is significant indirectly because it impacts the batting average). Sides winning more games will have better average, SR & economy in LO games for sure, which probably is understandable. However, depending on the win margins, figures might differ case to case basis. For example, take this PAK-AUS series - I am sure the average, SR & economy chart will be much closer than 5-0 margin.
Looking at the batting average or SR, without looking at the other side (bowling), could be a bit misleading because per for each game is different. Take ENG, they are the top ODI side these days and their batting SR is quite high, but same is their bowling economy - which suggests that in general ENG have participated more numbers of high scoring games where per for the game was higher. Similarly, bowling stats for Bangladesh is flattering - only 2nd to AFGs in economy and quite high in average table as well, and these stats would have been significantly better before the NZ series. It indicates two clues: we have played more low scoring games, and we have played more against lower ranked teams (whose stats are lower in the rank of these tables as well).
Overall, excluding AFGs, IND, ENG & NZ has significantly better & balanced stats, while PAK, WIN & SRL has inferior stats - which indicates in their ranking as well. But, ranking is done over 3+ years performance and you have taken data for last 15 months, hence PAK's stats are much worse than the ranking position, because it's not capturing CT'17 win, 5-0 against SRL & 6-1 against WIN. And, if you go back by 3 months to include those 3 ODIs in SAF, BD's stats will be much worse in terms of bowling, but a little better in batting, because those were very high scoring games. Also, some teams are playing higher ranked (In terms of stats in the tables) teams more, while some teams are doing opposite - that makes IND, NZ, SAF & ENG's stats (& Gap) even more significant.
If you run the tables exactly from the date ICC ranking is accounted for, I am sure the correlation between the stats, or the "Gap" will be very high with team's respective ranking position.
