ahmedwaqas92
ODI Debutant
- Joined
- Dec 26, 2013
- Runs
- 10,582
- Post of the Week
- 4
Five-part detailed comparison on Pakistan first-class batting metrics & analyses – Last four seasons
On most occasions when we gauge Pakistan first-class batting performances, almost every single time; sports journalists, media personnel & even the fans (bloggers, informed cricket followers) bring up the average of a batsmen to make a certain point. Now, straight off the bat I would like to ascertain that by no means is the batting average not a good metric, as a matter of fact it is one of the baselines of this study as well however, solely relying on the batting average can effectively mask the true essence of an unbiased study which could very well mean that, at the end of the day, a candidate who might not be the best fit for the team gets the nod (for selection) while a bloke that could essentially be more valuable to the team’s cause gets ignored.
Also, making any stark decisions on selections, based on batting averages has a very damning loop hole – the ‘not out’ factor. A player performing for the middle / lower order could very well have an inflated average (albeit slightly only) for a season, if he bags a couple of not outs across multiple innings, due to a batting collapse or for whatever reason, while this might lead to ‘indicate’ the batsmen to having a higher run scoring capacity than he might originally have.
These reasons led me to consider RPI (runs per innings) as an evaluating metric when comparing two sets of individuals. Simply put RPI is calculated by dividing the total runs scored in the population by the total number of observations (innings). The RPI actually standardizes the capacity of a batsmen’s genuine run scoring ability as it negates the inflating factors of ‘not outs’ from the analysis. Also RPI gives the true picture of what to expect from a batsmen under ‘normal’ circumstances & therefore provides the cornerstone of metric based comparisons in this study.
Another grave hindrance to any cricket relating comparison (especially when considering batting metrics) is the ‘longevity test’. A player could essentially hit a purple patch, make the rounds of the media due to influential campaigners and then get selected all the while ignoring the simple notion, that the player in question might not have the relevant ceiling or sustainability factor which would enable him to go the long haul, If & when his purple patch might be over.
To counter the above problem I have taken into account, metrics of performers across last four seasons of our first class tournament starting from 2014 up until 2017. Also, the longevity test actually normalizes a player’s scores over the course of multiple seasons, which means that an inflated average or RPI due to a purple patch in one season would ideally normalize in the other seasons due to playing conditions, the different strengths of bowling attacks a batsmen might face, his own personal form so on and so forth. If the batsmen truly is a very consistent run scorer then his RPI would essentially reflect that as well.
The Sampling Criteria
To sample a population & record their relevant observations I needed a criteria that wouldn’t necessarily cause the same problem as I stated above however, unfortunately the only available metrics that I could filter for our domestic batsmen were either:
(i) Their Batting Averages (Ascending or Descending)
(ii) Total Runs Scored (Ascending or Descending)
(iii) Number of Matches (Ascending or Descending)
This lead me to filter by descending average of the top 10 batsmen each among all four seasons but as an additional filter I made sure that the top 10 batsmen which featured in this criteria should’ve at least played six games (minimum) in that particular season to be considered for such. The thought process behind this criteria actually was that if a team went the long haul in a given season (let’s say they played the final) then that department / region would’ve played 11 games in total. 6 games is a little more than 50% (54.45% to be exact) and would be a good enough sample size to gauge a batsman, if and only when we’re considering his ‘average’ as a benchmark. The list that compiled for all four seasons starting from 2014 – 2017 is as follows (please note names are in descending order of their respective averages):

You might’ve noticed that a few of the names are repeated in multiple seasons. This is because those players have performed in more than one Quaid-e-Azam trophy tournament in the given period (2014-217). Players like Fawad Alam, Usman Salauddin, Kamran Akmal, Ali Asad et al, are those such names however, over the course of these four seasons the top performance (in any given one season), based on the above filter have been 38 distinct individuals (domestically).
In addition, to these 38 individuals I’ve personally added Sami Aslam, Shan Masood & Babar Azam to see how much they’ve scored (in first class games only) in the same period & how does that (RPI and other derived metrics) particularly correlate to the difference between what a person scores in domestic cricket & by how much those numbers would, increase or decrease, when that ‘jump’ into international cricket is made from first class – That is why the ‘current’ column is added to show our core test team as a comparison POV.
The column of ‘benchmark’ is there for us to gauge our two top test batters since 2010 to the upcoming crop & who among the FC players might be the closest replacement to #MisYou. For this very reason I have added numbers for Younis & Misbah as well. Although, one might say that it is nostalgia which might be forcing me to add them to the narrative but let’s be honest here, their presence & numbers (which you will see later on) were the backbone for team Pakistan, at least, in Asia.
While no matter if we get different players (characteristically) from them, any two individuals that can emulate their batting numbers, heck even 70% of that, would be no less than gold dust to our test team.
The standard format of the tournament (Quaid e Azam) trophy for each team is basically seven pool games, followed by a super eight round, comprising of three more games (upon qualification) and consequently a deciding final (upon further qualification from Super Eights).
The teams (departments & regions) are initially divided in two pools of 8 teams (16 in total) and then 4 a piece in the super eight groups. This has been the default way of how QeA has been functioning in recent years apart from only 2014 where the PCB spilt the tournament in Gold & Silver trophies which is why the 2014 bracket has two top 10s here as well.
There are also some players who narrowly missed the above qualification criteria, mostly due to missing out on the minimum required number of games that we might be using here. I’ve not included them in this compilation as that would open a lot of hypotheticals. Also, there would be no point in having the filter if we are to include everyone who might be just ‘close enough’ for the criteria. However, in the spirit that we know who those blokes are, here is the list of names, with the year and their corresponding team for those that might’ve missed out:

Among all of these players, only Fakhar Zaman & Faizan Riaz featured again in the corresponding years 2016 and 2017 respectively; subsequent to the prior ones they missed out on in 2015 & 2016. The rest all of them (apart from Babar who we intentionally draw from for the International to domestic comparisons) no one gets to be part of the list of 38 players that our study narrowed it down to.
For a very long time, it emphatically frustrated me that no one single sports journalist, analyst or even media personnel gave any thought on establishing context to the performances in our Pakistan first class structure while even today & quite unfortunately as well, we have no benchmark on what exactly constitutes a noteworthy performing FC individual.
Another sad aspect of all this culminates into the simple fact that we have numerous people playing and churning out the numbers for nearly a decade (in some cases) while others doing similar bits for more than 5+ years yet somehow, and I mean no offense to anyone when I say this, most of these players do not have any recognition from the PCB, the fans or even individuals that are, or might be, covering these first class tournaments as an occupational profession (in most cases i.e.).
Everyone, hears the Fawad Alam(s), the Kamran Akmal(s), the Salman Butt(s) (A proper myth as this study will show) making runs in our first class tournaments but no one effectively highlights the other individuals that might be, more or less, in the same run scoring bracket as these celebrated ‘top performers’.
These are the reasons why I personally decided to embark upon, in at least providing some ground work for, establishing proper context to these performances in our domestic setup (FC Only). Also this post will be in multiple parts so please read though the opening thread starter along with the additional ones that I might be following up with (in addition) to this OP.
Furthermore, there might’ve been people or institutions that would’ve simulated a similar compilation previously as well (I won’t claim this to be the first one to come up with this, as I am sure there would be someone else as well) however in researching similar compilations across Google & other search engines I couldn’t necessarily find any relevant or similar studies AT ALL – which is why I think that, even if someone did attempt it previously, a refresher course (of sorts) is necessary, in one of the most viewed cricketing discussion board out there right now.
On most occasions when we gauge Pakistan first-class batting performances, almost every single time; sports journalists, media personnel & even the fans (bloggers, informed cricket followers) bring up the average of a batsmen to make a certain point. Now, straight off the bat I would like to ascertain that by no means is the batting average not a good metric, as a matter of fact it is one of the baselines of this study as well however, solely relying on the batting average can effectively mask the true essence of an unbiased study which could very well mean that, at the end of the day, a candidate who might not be the best fit for the team gets the nod (for selection) while a bloke that could essentially be more valuable to the team’s cause gets ignored.
Also, making any stark decisions on selections, based on batting averages has a very damning loop hole – the ‘not out’ factor. A player performing for the middle / lower order could very well have an inflated average (albeit slightly only) for a season, if he bags a couple of not outs across multiple innings, due to a batting collapse or for whatever reason, while this might lead to ‘indicate’ the batsmen to having a higher run scoring capacity than he might originally have.
These reasons led me to consider RPI (runs per innings) as an evaluating metric when comparing two sets of individuals. Simply put RPI is calculated by dividing the total runs scored in the population by the total number of observations (innings). The RPI actually standardizes the capacity of a batsmen’s genuine run scoring ability as it negates the inflating factors of ‘not outs’ from the analysis. Also RPI gives the true picture of what to expect from a batsmen under ‘normal’ circumstances & therefore provides the cornerstone of metric based comparisons in this study.
Another grave hindrance to any cricket relating comparison (especially when considering batting metrics) is the ‘longevity test’. A player could essentially hit a purple patch, make the rounds of the media due to influential campaigners and then get selected all the while ignoring the simple notion, that the player in question might not have the relevant ceiling or sustainability factor which would enable him to go the long haul, If & when his purple patch might be over.
To counter the above problem I have taken into account, metrics of performers across last four seasons of our first class tournament starting from 2014 up until 2017. Also, the longevity test actually normalizes a player’s scores over the course of multiple seasons, which means that an inflated average or RPI due to a purple patch in one season would ideally normalize in the other seasons due to playing conditions, the different strengths of bowling attacks a batsmen might face, his own personal form so on and so forth. If the batsmen truly is a very consistent run scorer then his RPI would essentially reflect that as well.
The Sampling Criteria
To sample a population & record their relevant observations I needed a criteria that wouldn’t necessarily cause the same problem as I stated above however, unfortunately the only available metrics that I could filter for our domestic batsmen were either:
(i) Their Batting Averages (Ascending or Descending)
(ii) Total Runs Scored (Ascending or Descending)
(iii) Number of Matches (Ascending or Descending)
This lead me to filter by descending average of the top 10 batsmen each among all four seasons but as an additional filter I made sure that the top 10 batsmen which featured in this criteria should’ve at least played six games (minimum) in that particular season to be considered for such. The thought process behind this criteria actually was that if a team went the long haul in a given season (let’s say they played the final) then that department / region would’ve played 11 games in total. 6 games is a little more than 50% (54.45% to be exact) and would be a good enough sample size to gauge a batsman, if and only when we’re considering his ‘average’ as a benchmark. The list that compiled for all four seasons starting from 2014 – 2017 is as follows (please note names are in descending order of their respective averages):

You might’ve noticed that a few of the names are repeated in multiple seasons. This is because those players have performed in more than one Quaid-e-Azam trophy tournament in the given period (2014-217). Players like Fawad Alam, Usman Salauddin, Kamran Akmal, Ali Asad et al, are those such names however, over the course of these four seasons the top performance (in any given one season), based on the above filter have been 38 distinct individuals (domestically).
In addition, to these 38 individuals I’ve personally added Sami Aslam, Shan Masood & Babar Azam to see how much they’ve scored (in first class games only) in the same period & how does that (RPI and other derived metrics) particularly correlate to the difference between what a person scores in domestic cricket & by how much those numbers would, increase or decrease, when that ‘jump’ into international cricket is made from first class – That is why the ‘current’ column is added to show our core test team as a comparison POV.
The column of ‘benchmark’ is there for us to gauge our two top test batters since 2010 to the upcoming crop & who among the FC players might be the closest replacement to #MisYou. For this very reason I have added numbers for Younis & Misbah as well. Although, one might say that it is nostalgia which might be forcing me to add them to the narrative but let’s be honest here, their presence & numbers (which you will see later on) were the backbone for team Pakistan, at least, in Asia.
While no matter if we get different players (characteristically) from them, any two individuals that can emulate their batting numbers, heck even 70% of that, would be no less than gold dust to our test team.
The standard format of the tournament (Quaid e Azam) trophy for each team is basically seven pool games, followed by a super eight round, comprising of three more games (upon qualification) and consequently a deciding final (upon further qualification from Super Eights).
The teams (departments & regions) are initially divided in two pools of 8 teams (16 in total) and then 4 a piece in the super eight groups. This has been the default way of how QeA has been functioning in recent years apart from only 2014 where the PCB spilt the tournament in Gold & Silver trophies which is why the 2014 bracket has two top 10s here as well.
There are also some players who narrowly missed the above qualification criteria, mostly due to missing out on the minimum required number of games that we might be using here. I’ve not included them in this compilation as that would open a lot of hypotheticals. Also, there would be no point in having the filter if we are to include everyone who might be just ‘close enough’ for the criteria. However, in the spirit that we know who those blokes are, here is the list of names, with the year and their corresponding team for those that might’ve missed out:

Among all of these players, only Fakhar Zaman & Faizan Riaz featured again in the corresponding years 2016 and 2017 respectively; subsequent to the prior ones they missed out on in 2015 & 2016. The rest all of them (apart from Babar who we intentionally draw from for the International to domestic comparisons) no one gets to be part of the list of 38 players that our study narrowed it down to.


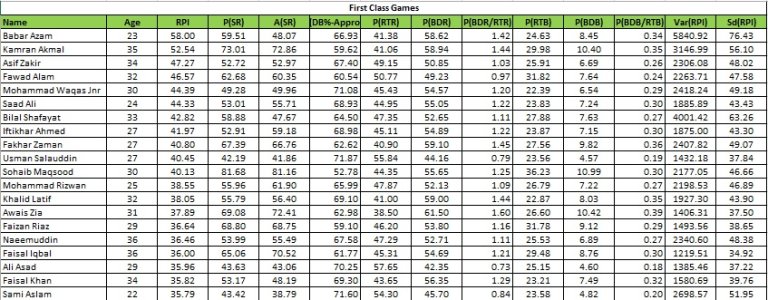
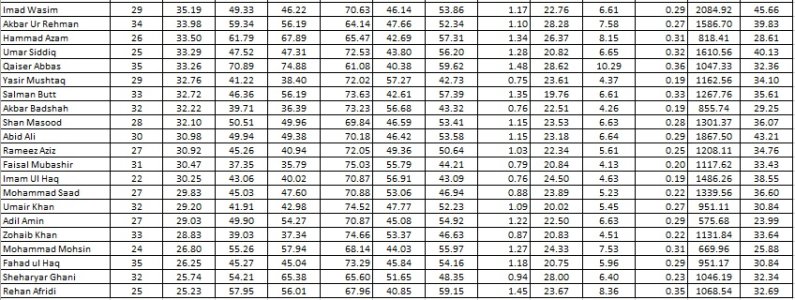
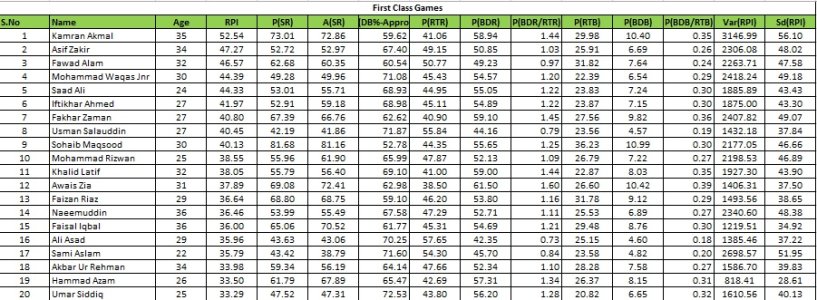

 , he’s 15th (on the overall) list and not surprisingly has a better RPI compared to all 1,2 and 3 of our test regulars.


 followed by Fakhar Zaman, Usman Salauddin and others. The only Test regular from this age group is Shan Masood who features in the bottom half of the table (9th Position out of 13).


