What's new

Five-part detailed comparison on Pakistan first-class batting metrics & analyses – Last four seasons

ahmedwaqas92

ODI Debutant
Joined
Dec 26, 2013
Runs
10,582
Post of the Week
4
Five-part detailed comparison on Pakistan first-class batting metrics & analyses – Last four seasons

For a very long time, it emphatically frustrated me that no one single sports journalist, analyst or even media personnel gave any thought on establishing context to the performances in our Pakistan first class structure while even today & quite unfortunately as well, we have no benchmark on what exactly constitutes a noteworthy performing FC individual.

Another sad aspect of all this culminates into the simple fact that we have numerous people playing and churning out the numbers for nearly a decade (in some cases) while others doing similar bits for more than 5+ years yet somehow, and I mean no offense to anyone when I say this, most of these players do not have any recognition from the PCB, the fans or even individuals that are, or might be, covering these first class tournaments as an occupational profession (in most cases i.e.).

Everyone, hears the Fawad Alam(s), the Kamran Akmal(s), the Salman Butt(s) (A proper myth as this study will show) making runs in our first class tournaments but no one effectively highlights the other individuals that might be, more or less, in the same run scoring bracket as these celebrated ‘top performers’.

These are the reasons why I personally decided to embark upon, in at least providing some ground work for, establishing proper context to these performances in our domestic setup (FC Only). Also this post will be in multiple parts so please read though the opening thread starter along with the additional ones that I might be following up with (in addition) to this OP.

Furthermore, there might’ve been people or institutions that would’ve simulated a similar compilation previously as well (I won’t claim this to be the first one to come up with this, as I am sure there would be someone else as well) however in researching similar compilations across Google & other search engines I couldn’t necessarily find any relevant or similar studies AT ALL – which is why I think that, even if someone did attempt it previously, a refresher course (of sorts) is necessary, in one of the most viewed cricketing discussion board out there right now.

On most occasions when we gauge Pakistan first-class batting performances, almost every single time; sports journalists, media personnel & even the fans (bloggers, informed cricket followers) bring up the average of a batsmen to make a certain point. Now, straight off the bat I would like to ascertain that by no means is the batting average not a good metric, as a matter of fact it is one of the baselines of this study as well however, solely relying on the batting average can effectively mask the true essence of an unbiased study which could very well mean that, at the end of the day, a candidate who might not be the best fit for the team gets the nod (for selection) while a bloke that could essentially be more valuable to the team’s cause gets ignored.

Also, making any stark decisions on selections, based on batting averages has a very damning loop hole – the ‘not out’ factor. A player performing for the middle / lower order could very well have an inflated average (albeit slightly only) for a season, if he bags a couple of not outs across multiple innings, due to a batting collapse or for whatever reason, while this might lead to ‘indicate’ the batsmen to having a higher run scoring capacity than he might originally have.

These reasons led me to consider RPI (runs per innings) as an evaluating metric when comparing two sets of individuals. Simply put RPI is calculated by dividing the total runs scored in the population by the total number of observations (innings). The RPI actually standardizes the capacity of a batsmen’s genuine run scoring ability as it negates the inflating factors of ‘not outs’ from the analysis. Also RPI gives the true picture of what to expect from a batsmen under ‘normal’ circumstances & therefore provides the cornerstone of metric based comparisons in this study.

Another grave hindrance to any cricket relating comparison (especially when considering batting metrics) is the ‘longevity test’. A player could essentially hit a purple patch, make the rounds of the media due to influential campaigners and then get selected all the while ignoring the simple notion, that the player in question might not have the relevant ceiling or sustainability factor which would enable him to go the long haul, If & when his purple patch might be over.

To counter the above problem I have taken into account, metrics of performers across last four seasons of our first class tournament starting from 2014 up until 2017. Also, the longevity test actually normalizes a player’s scores over the course of multiple seasons, which means that an inflated average or RPI due to a purple patch in one season would ideally normalize in the other seasons due to playing conditions, the different strengths of bowling attacks a batsmen might face, his own personal form so on and so forth. If the batsmen truly is a very consistent run scorer then his RPI would essentially reflect that as well.

The Sampling Criteria

To sample a population & record their relevant observations I needed a criteria that wouldn’t necessarily cause the same problem as I stated above however, unfortunately the only available metrics that I could filter for our domestic batsmen were either:

(i) Their Batting Averages (Ascending or Descending)
(ii) Total Runs Scored (Ascending or Descending)
(iii) Number of Matches (Ascending or Descending)

This lead me to filter by descending average of the top 10 batsmen each among all four seasons but as an additional filter I made sure that the top 10 batsmen which featured in this criteria should’ve at least played six games (minimum) in that particular season to be considered for such. The thought process behind this criteria actually was that if a team went the long haul in a given season (let’s say they played the final) then that department / region would’ve played 11 games in total. 6 games is a little more than 50% (54.45% to be exact) and would be a good enough sample size to gauge a batsman, if and only when we’re considering his ‘average’ as a benchmark. The list that compiled for all four seasons starting from 2014 – 2017 is as follows (please note names are in descending order of their respective averages):

CompletePlayerList.jpg

You might’ve noticed that a few of the names are repeated in multiple seasons. This is because those players have performed in more than one Quaid-e-Azam trophy tournament in the given period (2014-217). Players like Fawad Alam, Usman Salauddin, Kamran Akmal, Ali Asad et al, are those such names however, over the course of these four seasons the top performance (in any given one season), based on the above filter have been 38 distinct individuals (domestically).

In addition, to these 38 individuals I’ve personally added Sami Aslam, Shan Masood & Babar Azam to see how much they’ve scored (in first class games only) in the same period & how does that (RPI and other derived metrics) particularly correlate to the difference between what a person scores in domestic cricket & by how much those numbers would, increase or decrease, when that ‘jump’ into international cricket is made from first class – That is why the ‘current’ column is added to show our core test team as a comparison POV.

The column of ‘benchmark’ is there for us to gauge our two top test batters since 2010 to the upcoming crop & who among the FC players might be the closest replacement to #MisYou. For this very reason I have added numbers for Younis & Misbah as well. Although, one might say that it is nostalgia which might be forcing me to add them to the narrative but let’s be honest here, their presence & numbers (which you will see later on) were the backbone for team Pakistan, at least, in Asia.

While no matter if we get different players (characteristically) from them, any two individuals that can emulate their batting numbers, heck even 70% of that, would be no less than gold dust to our test team.

The standard format of the tournament (Quaid e Azam) trophy for each team is basically seven pool games, followed by a super eight round, comprising of three more games (upon qualification) and consequently a deciding final (upon further qualification from Super Eights).

The teams (departments & regions) are initially divided in two pools of 8 teams (16 in total) and then 4 a piece in the super eight groups. This has been the default way of how QeA has been functioning in recent years apart from only 2014 where the PCB spilt the tournament in Gold & Silver trophies which is why the 2014 bracket has two top 10s here as well.

There are also some players who narrowly missed the above qualification criteria, mostly due to missing out on the minimum required number of games that we might be using here. I’ve not included them in this compilation as that would open a lot of hypotheticals. Also, there would be no point in having the filter if we are to include everyone who might be just ‘close enough’ for the criteria. However, in the spirit that we know who those blokes are, here is the list of names, with the year and their corresponding team for those that might’ve missed out:

MissoutPlayers.jpg

Among all of these players, only Fakhar Zaman & Faizan Riaz featured again in the corresponding years 2016 and 2017 respectively; subsequent to the prior ones they missed out on in 2015 & 2016. The rest all of them (apart from Babar who we intentionally draw from for the International to domestic comparisons) no one gets to be part of the list of 38 players that our study narrowed it down to.
 
continued page 2

The Vocabulary Used

RPI – Runs Scored Per Innings

P – Periodic

A – Aggregate

SS – Scoring Shot (displayed as a percentage)

RS – Runs Scored

RT – Runs Scored in Rotation (1s, 2s and 3s)

BD – Runs scored in Boundaries (4s and 6s)

BF – Balls Faced

F – Variable used to define ‘four’ runs

M – Variable used to define ‘six’ (maximum) runs

P(SR) – Periodic strike rate; the actual strike rate of a batsman over the course of the entire selected population

A(SR) – Aggregate strike rate; implies the mean (x̅) of the strike rates induced over the course of the entire population. Gives a more accurate account of what SR we should ‘expect’ from a batsmen under normal circumstances.

P(RTR) – Periodic runs scored in rotation (In percentage). Here, I have taken rotation as the runs conceded from 1s, 2s and 3s however, since for most of the matches there is no available record for 2s and 3s I am considering runs scored in rotation as a singular unit (of run) per ball incurred. This is so that I may be able to standardize the entire process and eliminate any discrepancy due to the approximation that I am using here. Based on the preceding explanation, the derived P(RTR) is as follows:

RotationRuns.jpg

P(BDR) – Periodic runs scored in boundaries (in percentage). Simply put the runs incurred in boundaries for any given batsmen based on sum of total population. Expression below derives P(BDR) as an overall percentage:

BoundariesRuns.jpg

P(DB% - Approx) – Periodic Dot ball percentage induced by a batsmen during the course of each of their innings. The use of dot ball percentage over here is the closest approximation that I could personally come up with as there was no recorded data on the PCB website for twos (2s) and threes (3s). Below is the derivative of the (DB% - Approx) variable based on the P(RTR) & P(BDR):

DB1.jpg

The above equation then simplifies to the following derived notation:

DB2.jpg

P(BDR/RTR) – Periodic Ratio Between Percentage Runs Scored in Boundaries Upon Rotation. If the ratio is near 1.0 (approaching => 1.0) then the batsman can be classified as ‘dynamic’. If the ratio is above 1.0, the batsmen can be termed ‘most dynamic’ however, if the batsmen is below 1.0 while (approaching => 0) then the batsmen can be termed ‘least dynamic’.

P(RTB) – Periodic runs scored in terms of balls incurred for rotation, expressed in percentage (1s, 2s, and 3s – Hypothetically). Below is the mathematical classification of the said derived formulae:

RotationBalls.jpg

P(BDB) – Periodic runs scored in terms of balls incurred for boundaries (also in percentage). The notion is as follows:

BoundariesBalls.jpg

P(BDB/RTB) – Periodic ratio between percentage balls consumed in boundaries upon percentage balls consumed in rotation. If the value is near 1.0 (approaching => 1.0) then batsmen is ‘neutral’ however, if the ratio is > 1.0 the batsmen can be termed ‘expansive’ . Also, a batsman will be considered ’conservative’ if his P(BDB/RTB) value will be less than 1.0 & (approaching => 0)

Var(RPI) – Calculated Variance on Runs Per Innings. The variance of a batsmen defines his ability on whether he can go & score those big daddy hundreds or not. The variance actually tell us the ceiling of a batsmen & his aptitude / appetite of going the long haul. A higher variance means that the batsmen in question will be most suitable to play a long innings than that with a low or relatively lower value.
Later on in this study, we will also note that this particular relationship holds true for most of the domestic as well as international bats and therefore will be a key descriptive attribute when gauging the intrinsic batting ability of two individuals. Below is the mathematical notation used for Variance for the entire population of (RPI):

Var.jpg

Sd(RPI) – Calculated Standard Deviation on Runs Per Innings. The Standard deviation actually tells us the scores for a batsmen and how each of them (the scores) can be termed as ‘average’, ‘above average’, ‘below average’, ‘poor’ or ‘extraordinary’. The Sd of any batsmen mostly factors in when we are trying to find percentage of scores that are within the bounds of deviation and also above and below it. The mathematical notation for RPI, since it is based on total population is as below:

StandardDeviation.jpg

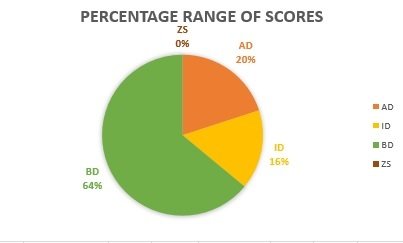
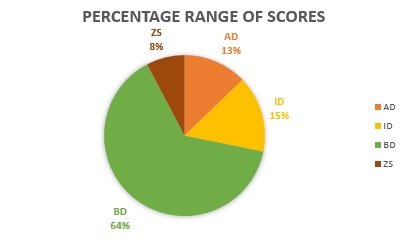
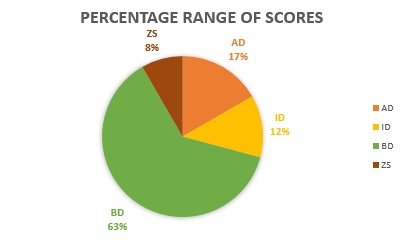
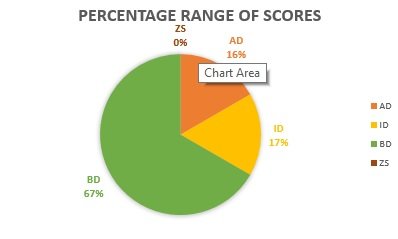
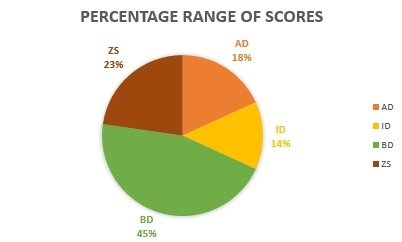
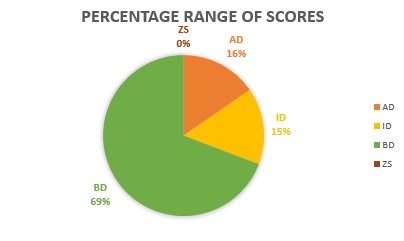
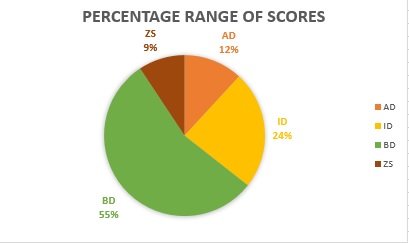
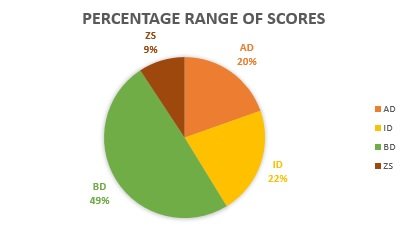
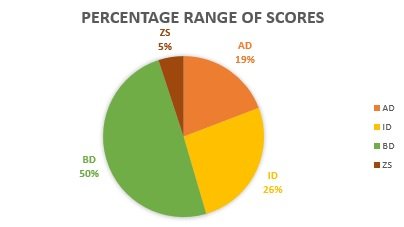
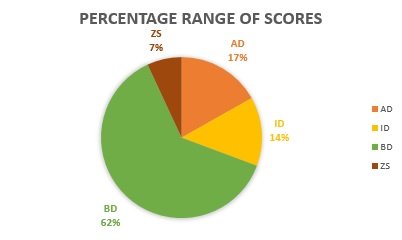
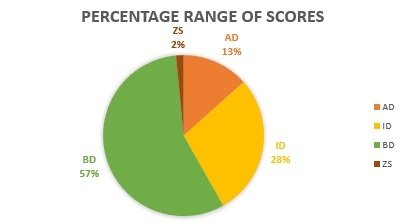
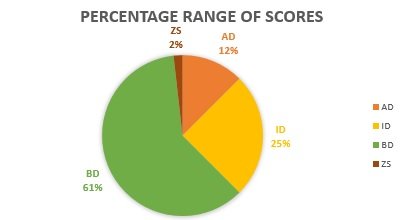
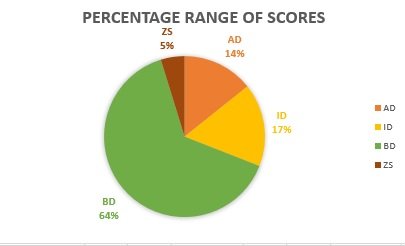
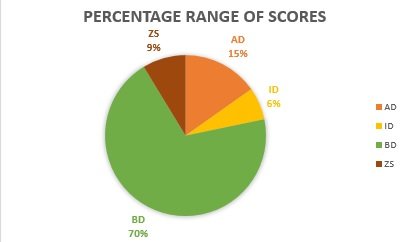
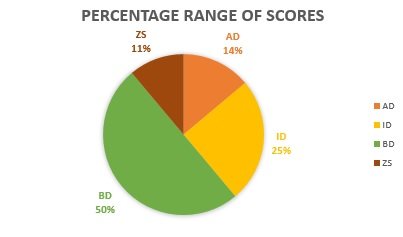
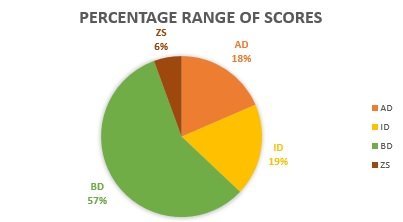
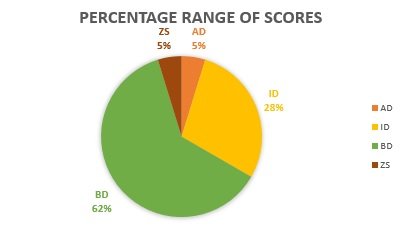
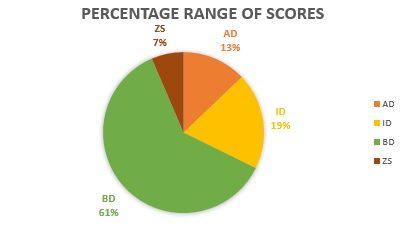
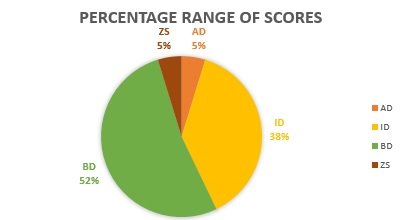
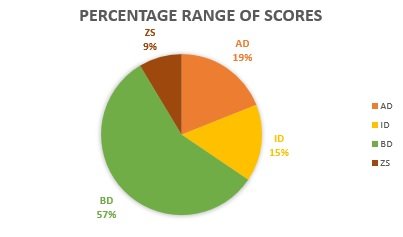
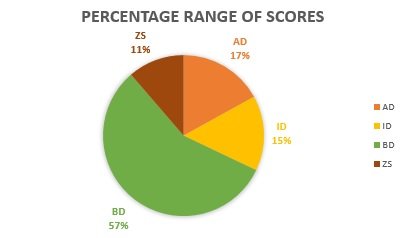
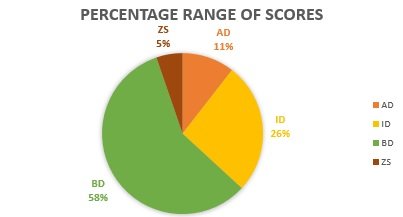
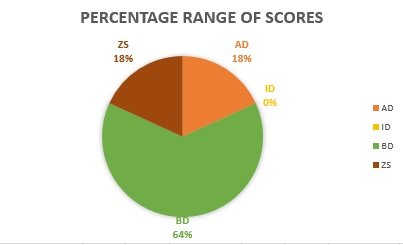
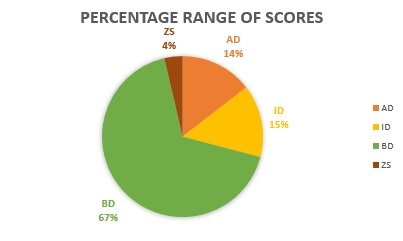
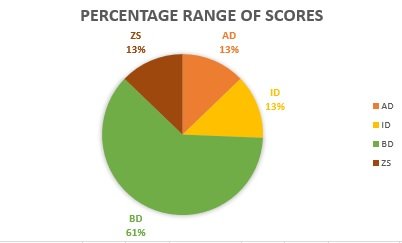
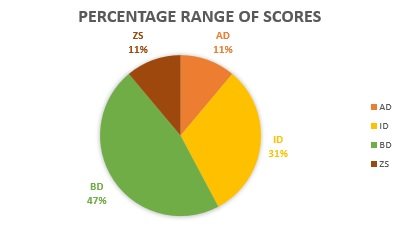
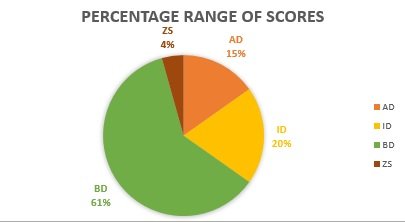
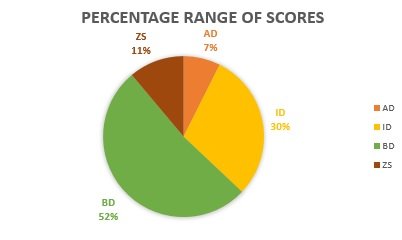
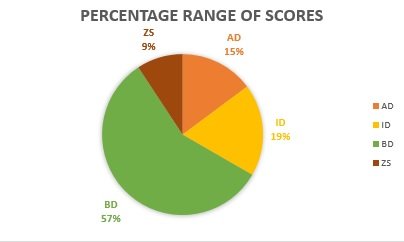
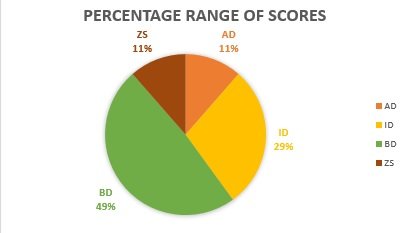
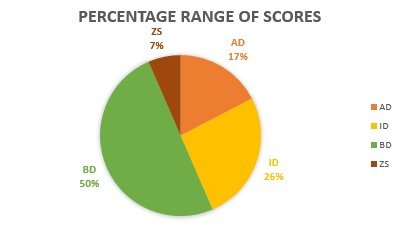
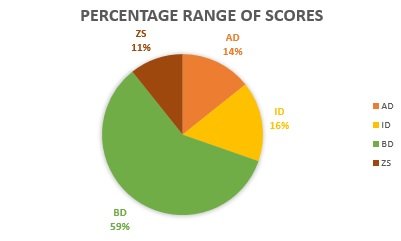
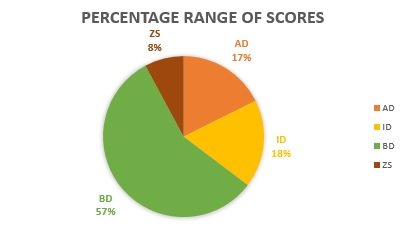
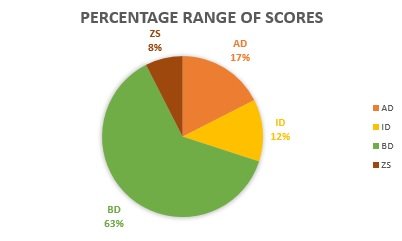
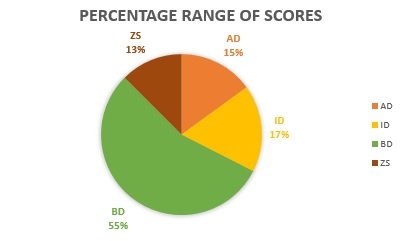
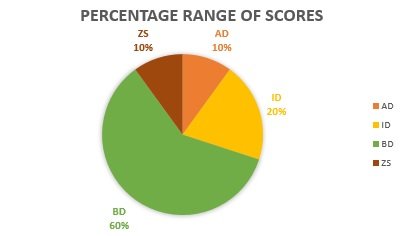
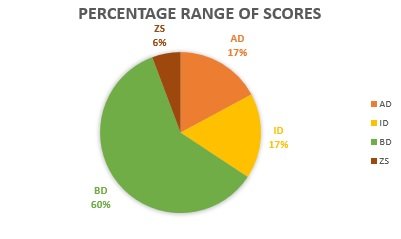
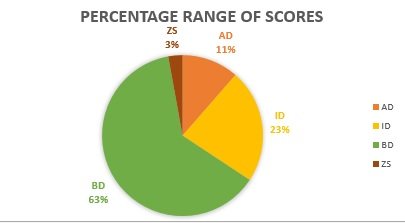
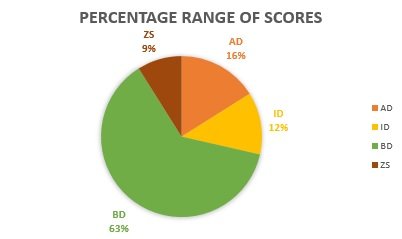
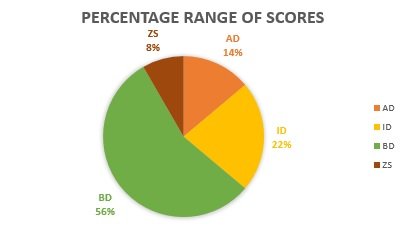
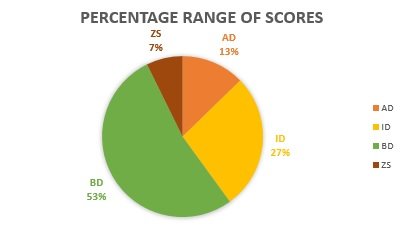
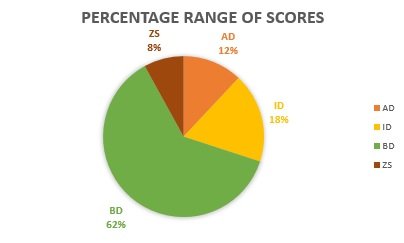
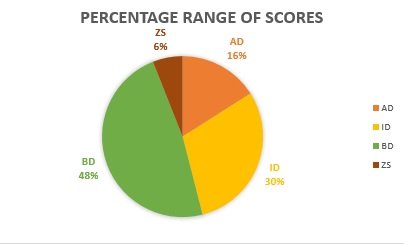
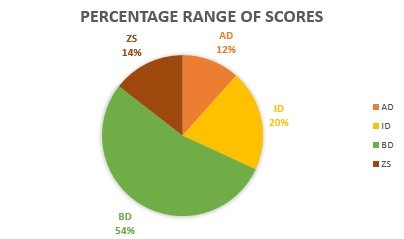
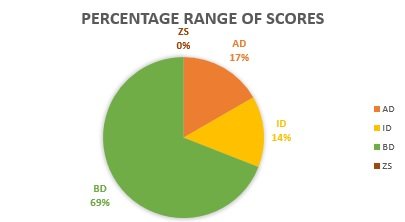
AD – Above Deviation; scores incurred for individual innings that are > the deviation i.e. [RPI + Sd(RPI)]

ID – In Deviation; scores incurred for individual innings that are ≤ sd(RPI) but > (RPI)

BD – Below Deviation; scores incurred for individual innings that are ≤ (RPI) but > 0.

ZS – Zero Scores; scores incurred for individual innings that are = (equal to) 0.
 
continued page 3

The main course

As we have now established the two main criteria for our compilation (context of selection to gauge the players & the relevant vocabulary to ensure that our readers grasp the various analysis terminologies) let us very quickly do the first filter on our 38 selected names and that of Sami, Shan and Babar as well. The following is purely based on the defined metrics in the two above mentioned posts (FC Only).

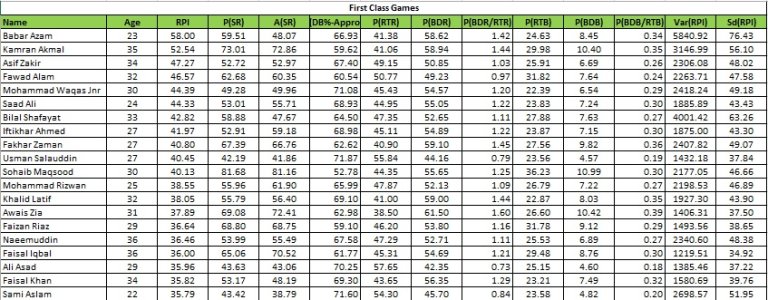
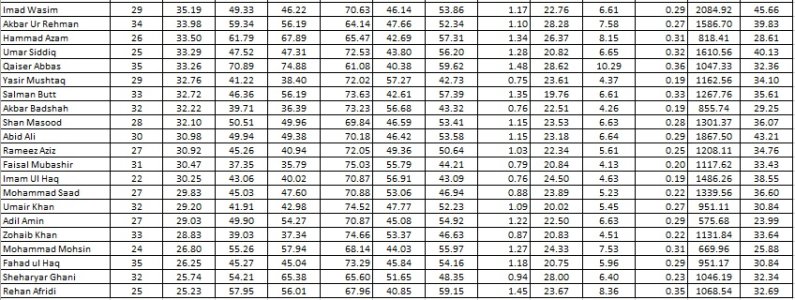
RpiDecendingUnfiltered1.jpg
RpiDecendingUnfiltered2.jpg

Right off the bat it might seem that Babar is leading domestic player when it comes to overall RPI during the last four seasons of the Quaid e Azam trophy however, what this unfiltered tabulation fails to highlight is the fact that Babar has only played 14 first class innings in the last 4 seasons of domestic 4 day games. A small sample size could very well inflate the RPI of a batsmen which is why we will now revert back to our 54.45% policy that we selected all the players from earlier.

If any particular player plays 6 games per season (minimum) then for 4 seasons worth of FC games he would, more or less, play 24 matches (48 innings). 48 innings for a period of 4 years now seems a bit higher as the most number of innings played by any individual is Mohammad Saad of Wapda (70 innings).

To counter this new hurdle I have proceeded to take 54.45 % of the 48 hypothetical innings that a batsmen (at minimum) would play. This filtering enabled us to reach an arbitrary number of 26 games or less as the cut off margin and consequently the following tabulated results were derived.

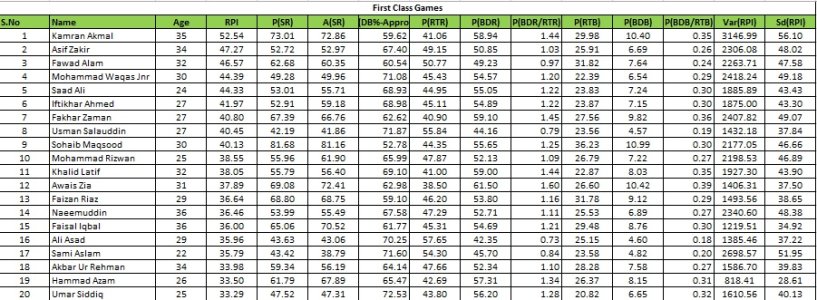
RpiDecendingFiltered1.jpg
RpiDecendingFiltered2.jpg

The above new tabulated results do give us a bit more context on the matter however they still don’t actually create a baseline of how players are performing (with regards to their long term value) and also in comparison to their peers. That being said, before we actually delve into all these there are a few specific data points I would like to highlight.

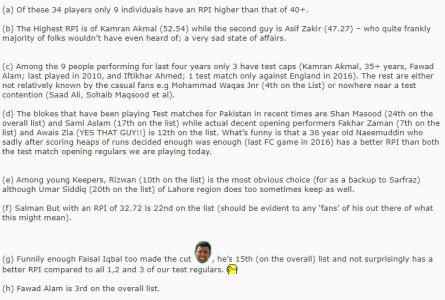
(a) Of these 34 players only 9 individuals have an RPI higher than that of 40+.

(b) The Highest RPI is of Kamran Akmal (52.54) while the second guy is Asif Zakir (47.27) – who quite frankly majority of folks wouldn’t have even heard of; a very sad state of affairs.


(c) Among the 9 people performing for last four years only 3 have test caps (Kamran Akmal, 35+ years, Fawad Alam; last played in 2010, and Iftikhar Ahmed; 1 test match only against England in 2016). The rest are either not relatively known by the casual fans e.g Mohammad Waqas Jnr (4th on the List) or nowhere near a test contention (Saad Ali, Sohaib Maqsood et al).

(d) The blokes that have been playing Test matches for Pakistan in recent times are Shan Masood (24th on the overall list) and Sami Aslam (17th on the list) while actual decent opening performers Fakhar Zaman (7th on the list) and Awais Zia (YES THAT GUY!!) is 12th on the list. What’s funny is that a 36 year old Naeemuddin who sadly after scoring heaps of runs decided enough was enough (last FC game in 2016) has a better RPI than both the test match opening regulars we are playing today.


(e) Among young Keepers, Rizwan (10th on the list) is the most obvious choice (for as a backup to Sarfraz) although Umar Siddiq (20th on the list) of Lahore region does too sometimes keep as well.

(f) Salman But with an RPI of 32.72 is 22nd on the list (should be evident to any ‘fans’ of his out there of what this might mean).


(g) Funnily enough Faisal Iqbal too made the cut :danish, he’s 15th (on the overall) list and not surprisingly has a better RPI compared to all 1,2 and 3 of our test regulars. :facepalm:

(h) Fawad Alam is 3rd on the overall list.

People who missed out after the cut off

Babar Azam – Played 14 Innings for NBP in between the four seasons plus a few games against the Sri Lankan – A team in 2015.

Imad – Although his RPI was very decent but he too only played 22 innings (less than the cut off) for Islamabad Region

Yasir Mushtaq – A fringe Karachi region player, 22 innings only

Faisal Khan – This guy featured for Sialkot Stallions in the 2014 in the QeA silver trophy, an RPI of 35+ in 23 innings so I guess he warrants a mention here.

Faisal Mubashir – An RPI of 30.xx in 20 innings while hailing from Bahawalpur. Another product of the 2014 Gold/Silver nonsense PCB came up with.

Bilal Shafayat – The most interesting player in this entire ‘missing’ list. Bilal Shafayat is actually not a Pakistan domestic player. The guy was an overseas player (from England, born in Nottingham) who last played a competitive game in 2014 (QeA Silver) for HBL. Cricinfo does not credit him with any more competitive games after that but just so I can give context to the narration here, while competing in the 2014 QeA silver he scored a double century and other valuable contributions for his department.

Mohammad Mohsin – A Lahore region player with having an RPI even before the cut off in the lower half of the tabulation. Mohammad Mohsin played 21 innings in the designated period and could only muster 25+ or an RPI for those games.

International Metrics

To have any context to the earlier tabulated results we would effectively need a comparison with the international test players as it becomes of paramount relevance that we would need a benchmark to evaluate further. With that in mind here are the results (based on RPI and similar metrics):

Internationals.jpg
Key.jpg

Not surprisingly Azhar (Since Debut), Misbah (2010 – Current) & Younis (2010 – Current) are the gun players of the team. They have an international RPI almost neck & neck to the top domestic performers in the last 4 seasons of QeA however, if we look at Babar, Shan and Sami then it would seem that domestic performances are a step below that of what one might score internationally, as the jump from Pakistan first class to Test matches could render a severe hit to a batsmen’s RPI.

From the above tabulation I will not consider Babar because (a) his domestic innings are of a very small sample size and (b) The discrepancy between his international and domestic numbers are at two extremes so the results would not be accurate. It also begs the question, that Babar Azam, one of the most heavily invested players by the PCB from a very young age has played a handful of tests and only a handful of first class games as well.

Call me a pessimist but this is not how a product is developed at the highest level. Babar Azam, should in my opinion, at least feature for 50% of the Pakistan domestic season as that would enable him to work on his weaknesses, iron out flaws in his game and develop the red ball game, which according to the numbers above needs a lot of work & effort.

This now leaves us with Sami and Shan who score 30.32 and 23.54 (RPI) respectively in international test matches. Their domestic numbers however, are 35.79 and 32.10 for both the individuals and now using these correlations we might be able to come up with a linear equation that could give us a trend line showing what to expect from the batsmen in question whenever they would make the ‘jump’ from domestics to internationals.

X = International Score
Y = Domestic Score

Solving both the values for X and Y we give us the following equation:

XYEquation.jpg

To now test whether our domestic to international linear equation is correct we will plug in Salman Butt’s domestic RPI in the above mentioned. This gives us X (Hypothetical International Score) = 29.23 while if we relate that same number to his international RPI on Asian conditions, 30.28 (Link Here) previously, then both the equation & the domestic RPI falls accurately within the bounds of the +/- 3% error that I have duly considered for any marginal mistake whatsoever.

Another key factor to note is the variance for each of the batsmen. Both Azhar & Younis have very high variances which is a solid representation of how both batsmen also have the ability to go big & score those daddy hundreds while Sarfraz, Misbah and Asad (three other regulars) have a substantially low Variance and consequently highest scores of just early hundreds (at best).
 
continued page 4

Age Based Tabulation – Domestic FC

On numerous occasions we find that certain players make the rounds of FC performance charts yet at the end of the day (on most occasions), none of them are selected & a year later they go back again to grinding out more runs only to be ignored once again. When you ask the selectors regarding the ouster; they may, on many occasion, cite reasons such as those ‘individuals’ not being among the future plans of the PCB.

While such a narration does hold true in a few instances on other occasions (primarily for anyone in their early 30s) this doesn’t necessarily hold true. This particular factor further led me to compartmentalize the performers, for the past 4 seasons, into age brackets to see clearly who might be the best fit for long term investment & which individuals are better for a short term, stop gap solutions as well.

We created 4 Age groups; Rookie (< 25), Junior (≥ 25, < 30), Senior (≥ 30, < 35) Senior Plus (≥ 35) and tabulated the results of the RPI table (after cut off) into these four distinct age brackets. These were the results.

Rookie.jpg

Among the Rookie performers Saad Ali is the leading player with the highest RPI among the three. He is almost 10 points above Sami & 15 points above Imam when it comes to runs per innings. His variance is high as well which suggests he has the intrinsic capacity to go & score big hundreds. The most interesting bit is that apart from scoring with a high RPI his P(BDR/RTR) is 1.22 which makes his playing style ‘most dynamic’ and in sync with modern standards of FC cricket.

The boy should ideally be drafted into the pro-setup of our national Test team as, in addition to being young and having ample time to even improve further, the lad is essentially giving a run of their money to seasoned FC run scores who are have almost 5-6 seasons worth of experience under their belt.

Purely on numbers (overall and otherwise), Saad Ali deserves a go and given his age I’d be very confident that he would most certainly make it at the test level.

Junior.jpg

The Junior age bracket should be the ideal age for someone to be inducted into the test team, the player would’ve made enough progress in the first class structure to hold a competitive edge and should’ve gauged (to a certain degree) on how a competitive playing environment looks like. Funnily enough, Iftikhar Ahmed holds the top spot in the ‘junior’ age bracket :afridi followed by Fakhar Zaman, Usman Salauddin and others. The only Test regular from this age group is Shan Masood who features in the bottom half of the table (9th Position out of 13).

As logic should dictate Fakhar Zaman & Usman Salauddin should be the potential replacements (even for people like Babar and Shafiq in the test team) however the fact that it took almost 3+ seasons for Usman to even come into contention tells the sorry state of how much of ‘research’ actually goes into picking a Test candidate.

It also signifies that Iftikhar, no matter whatever one might think of his real age, has been dealt unfairly as he was only given a handful opportunities to show his mettle at the international level. The lad’s been churning out a 40+ RPI for 4 seasons straight and for this feature alone he should’ve at least been given a fair chance.

Senior.jpg

The next category is the senior category in which we assess seasoned players such as Fawad Alam, Asif Zakir, Sohaib Maqsoob et al. These players are all bunched in an age group comprising from their early 30s up until 34. Among these peers 4 names make the rounds on merit – Fawad Alam, Asif Zakir, Mohammad Waqas Jnr and Sohaib Maqsood – We can also claim that Awais Zia might have a shot as well since opening is a very unstable position for Pakistan and him putting up a 37+ RPI is extremely decent reading.

That said, based on just pure numbers Asif Zakir is the man I would’ve chosen. The best RPI among his peers, a dynamic playing style based on the BDR/RTR ratio and a variance of nearly 2500 (showing his ability to go big as well) however, what works against him is his age i.e. 34 years.

Since we know that a 30+ individual barring some supreme fitness (like that of Misbah or Younis) can only peak for 3-4 seasons maximum and with Zakir already 34 it would be a very short term stop gap solution indeed. That is not to say that Asif Zakir doesn’t really deserve selection as if he were to be selected right now than it would be a just and fair call however Fawad, who’s RPI is only fractionally less than Zakir has almost the same batting numbers too.

Fawad’s BDR/RTR ratio is similar while his DB% is lower as well to that of Zakirs plus he’s 2 years junior which can imply that given his fitness he could serve Pakistan more prominently than Zakir under ‘normal circumstances’

From the tabulated result we can also take note that Mohammad Waqas Jnr and Sohaib Maqsood both have a 40.xx RPI, which is very good, considering the playing conditions of our first class tournament and the state of the pitches. Furthermore, both the batsmen are 30 years old which means that they can give even more leverage & utility (in the long run) than either of Fawad or Zakir. Fun Fact: Mohammad Waqas Jnr actually has the second best variance (overall) among all his peers and with a 40.xx RPI this lad needs to be given a serious look.

Another extremely important factor to note here is that most of the best performers or the most consistent performers in our domestic circuit all hover from 27-34 age bracket. This evidently tells us that because the pitches in FC are absolutely horrendous it takes numerous seasons of first class cricket for any budding youngster to get used to the two paced nature of it and therefore the peaking age for most batsmen is the 27-34 bracket.

The above further puts into perspective Saad Ali’s ability and contribution at the age of 24 and how he’s basically outscoring many of his senior peers by adapting & performing in these conditions at such a young age.

SeniorPlus.jpg

The last age bracket is that of ‘Senior Plus’ which constitutes top performers who are 35+ years old. Naturally, here Kamran Akmal (who is the overall highest RPI based individual as well) leads the Senior Plus category. His variance is the best among all along with the BDR/RTR and the BDB/RTB ratios too being the best as well. He is monumentally so far ahead of the curve that it makes it extremely hard to not overlook this brilliant display of FC consistency just because he’s 35+ right now.

Personally speaking I am not too sure where his fitness ranks at the moment but if we just put his numbers into that y = 1.8x – 19.9 equation it straight up gives a 40+ RPI based batsmen at the international (That’s better than Asad, Sarfraz, Babar, Sami, Shan et al) – if we just consider his batting. It is a real shame that K. Akmal is at that point in his career where these FC runs are almost painful for everyone involved (the fans, who wanted to see this Kamran Akmal during his peak, for the selectors to make sure they’re forward thinking to maybe to Kamran himself who is probably in the form of his life yet cannot or probably will not translate this golden run into a Test call up for the national team). An extremely depressing outcome if you ask me personally!
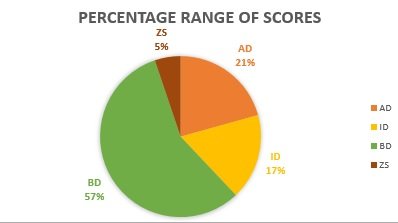
Naeemuddin is also one name that should make the previous selectors bow their heads in shame. The guy was one of the most consistently performing openers in the domestic FC circuit during 2012-2015 yet tour after tour we kept on picking mediocrity (Shehzad, Shan, Khuraam Manzoor, Hafeez) all featured to open for Pakistan yet a guy who was actually a proper test opener, churning out the runs was never given a go. Naeemuddin dis-heartedly played his last FC game back in 2016 and has not feature for the most recent (2017) QeA trophy.

The list also shows Faisal ‘the legend’ Iqbal who features on the 15th position into the overall tabulated result :shafiq2

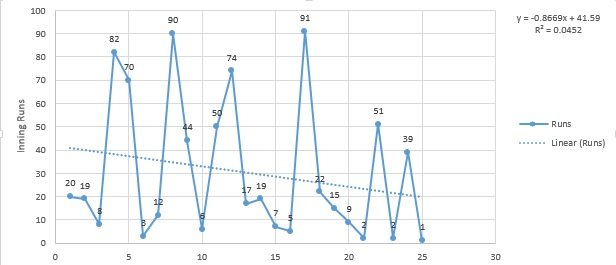
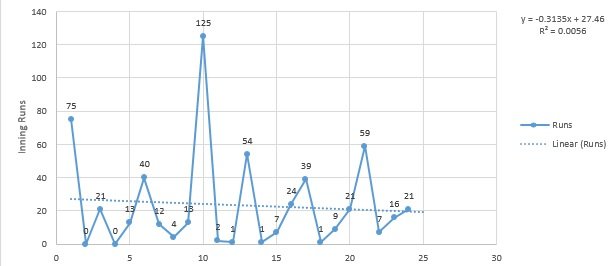
For further insight on the matter I will also proceed to add Graphical representation of the fluctuating RPI for everyone in those lists (All those 41 names) and have additionally added the percentage pie chart on how many scores are AD (above deviation), ID (in deviation), BD (Below deviation) and ZS (Zero Scores). If you don’t understand please check back the vocabulary section to and through the definitions of what I mean by these terms.
 
continued page 5

Limitations of the Process Used

As with every possible use of statistics this compilation too does have its limitations when it comes a 100% accurate assessment for ‘all things considered’. Realistically, the margin of error, since we essentially us a fair amount of approximation, is somewhere between +/- 3% (overall) while even with real time numbers the difference between player metrics would not induce any positional change whatsoever hence the error can be considered marginal (in the least) and with that, the following are the list of narrations that the study essentially ‘overlooks’:

1) When we use RPI, as stated earlier, we consider 1 innings as one observation so if anyone carries the bat throughout an innings that escalation effect is negated to normalize the data set. This facet however, works against the player if for instance that same batsmen is chasing a 4th Innings target and remains not out after guiding his side to victory.

2) The QeA (Quaid e Azam) trophy does not implement a valid home/away concept therefore I have not taken into account any filtration that would segregate the RPI of the batsmen based on different venues – different venue(s) imply different heights of the landscape relative to the sea level & therefore might simulate different environments. For example venues such as Rawalpindi & Abbottabad would ideally provide playing conditions conducive to seam & swing while the NSK and GS would have true bounce along with Faisalabad having UAE type slow low turning wickets et al.

3) I ignored the weather conditions and at what time of the year might a Pool match or Super Eight game is be played. This was done to standardize the study into a unitary model while reducing complexity and at the same time giving every individual an unbiased framework.

4) The accuracy of the data set used, is publicly available on the PCB official website. We have used those same numbers for each & every individual mentioned in this compilatory work. I made multiple efforts to make sure that the recordings of all observations were done accurately and therefore it took me nearly a month of checking, verifying and then checking again of all the readings, for the data in question, to be as accurate as possible. Even after all that I won’t be surprised if one or two recordings could be error prone so if you do find one, please let me know and I’ll try to plug in the numbers & improve this model furthermore.

It also doesn’t help that PCB has no records of 1s, 2s and 3s for the majority of its domestic (first class) I had to use a mathematical work around which I’ve stated in the vocabulary section on how to best get an approximation of the Dot Ball percentage.

Appendix I – International Player Progression Graphs

Sami Aslam

Internationals

1.jpg
2.jpg

Domestics

1.jpg
2.jpg

Shan Masood

Internationals

1.jpg
2.jpg

Domestics

1.jpg
2.jpg

Babar Azam

Internationals

1.jpg
2.jpg

Domestics

1.jpg
2.jpg

Azhar Ali

1.jpg
2.jpg

Asad Shafiq

1.jpg
2.jpg

Misbah ul Haq

1.jpg
2.jpg

Younis Khan

1.jpg
2.jpg
 
Sarfraz Ahmed

1.jpg
2.jpg

Appendix II – Domestic Player Progression Graphs

Fawad Alam

1.jpg
]2.jpg

Mohammad Rizwan

1.jpg
2.jpg

Ali Asad

1.jpg
2.jpg

Naeemuddin

1.jpg
2.jpg

Mohammad Waqas Jnr

1.jpg
2.jpg

Kamran Akmal

1.jpg
2.jpg

Iftikhar Ahmed

1.jpg
2.jpg

Imad Wasim

1.jpg
2.jpg

Umar Siddiq

1.jpg
2.jpg
 
Yasir Mushtaq

1.jpg
2.jpg

Usman Salahuddin

1.jpg
2.jpg

Faisal Khan

1.jpg
2.jpg

Rameez Aziz

1.jpg
2.jpg

Faisal Mubashir

1.jpg
2.jpg

Bilal Shafayat

1.jpg
2.jpg

Mohammad Mohsin

1.jpg
2.jpg

Fahad Ul Haq

1.jpg
2.jpg

Rehan Afridi

1.jpg
2.jpg

Faisal Iqbal

1.jpg
2.jpg
 
Awais Zia

1.jpg
2.jpg

Sheharyar Ghani

1.jpg
2.jpg

Zohaib Khan

1.jpg
2.jpg

Qaiser Abbas

1.jpg
2.jpg

Akbar Badshah

1.jpg
2.jpg

Akbar Ur Rehman

1.jpg
2.jpg

Asif Zakir

1.jpg
2.jpg

Khalid Latif

1.jpg
2.jpg

Umair Khan

1.jpg
2.jpg

Sohaib Maqsood

1.jpg
2.jpg
 
Fakhar Zaman

1.jpg
2.jpg

Adil Amin

1.jpg
2.jpg

Imam Ul Haq

1.jpg
2.jpg

Salman Butt

1.jpg
2.jpg

Saad Ali

1.jpg
2.jpg

Abid Ali

1.jpg
2.jpg

Hammad Azam

1.jpg
2.jpg

Faizan Riaz

1.jpg
2.jpg

Mohammad Saad

1.jpg
2.jpg


Finally, I would like to hear opinions & relevant ideas on how to further make this entire progression model better and more accurate while for this very reason I am going to publicly share the spreadsheet file that I maintained all throughout – The link is here
 
Will read it after my exams insha'Allah when I have a few days free. :yk

Great effort as always [MENTION=136079]ahmedwaqas92[/MENTION] :14:
 
For the people kind enough to have read this through the Salman Butt link is here

Enjoy :yk

This is an epic effort man. I cannot leave this thread without congratulating you on the effort. I will give it a more detailed read soon and get back for sure. I may not be able to comment on Pak domestic cricket, but sure am interested to see the details. Congrats once again.
 
Will read it after my exams insha'Allah when I have a few days free. :yk

Great effort as always [MENTION=136079]ahmedwaqas92[/MENTION] :14:

I know the entire thing kinda seems daunting :danish, but it took me around 35+ days to get this done from scratch. I estimated that it would take about 2 months to have something like this properly researched, since every single entry here (apart from those available for international players) is based on manually going through scorecards :facepalm: - (THANKS PCB!!)

Just so you know it's 6K + words with nearly a 100 jpeg files :P

Enjoy :ma

P.S. Appreciate the kind words as well brother :salute
 
Brilliant work. Will surely read it when I have some free time. I can imagine the amount of work this would have taken. Excellent work.
 
This is an epic effort man. I cannot leave this thread without congratulating you on the effort. I will give it a more detailed read soon and get back for sure. I may not be able to comment on Pak domestic cricket, but sure am interested to see the details. Congrats once again.

Thank You for all the kind words my friend!

This study actually came about because, personally speaking, I was getting frustrated with the lack of context to whenever someone brought up domestic first class performances. The media personnel (leading intelligent ones over here i.e. :( ), the fans, people with agendas all threw around numbers without actually understanding the context behind those scores of numbers.

Another thing that bothered me was they wouldn't necessarily compare the purple patch of a player to that of a consistency factor. These are the reasons why I believe for so we've had 1 tour wonders in the last 6-7. Nasir Jamshed comes to mind, Sohaib Maqsood et al. What we needed was a step by step detailed comparisons of players based on performance metrics that highlight longiveity, consistency and a batsmen's capacity to score runs.

When you combine the above three, you end up with some form of a baseline for selection. Only then can you actually apply the fitness and the age filters. While researching all the above what I personally think we are doing right now is getting the fitness and age filter as the primary criteria. That is messing up the whole process since people who are getting through (no offense to them) are EXTREMELY weak in their primary skill.

It is actually a representation plus a narration of who are the best performers in Pakistan domestic cricket that fill all three (Longievity, consistency and capacity) tests while at the same time they are then bracketed into age based comparison. (That's the entire compilation in a nutshell)

:)
 
Brilliant work. Will surely read it when I have some free time. I can imagine the amount of work this would have taken. Excellent work.

It is unfortunate, really! That no one single sports journalist, analyst (In a country) where cricket is followed in the millions ever tried to give context to our premier domestic tournaments and judge performances based on actual science rather than subjective 'he looks good while' playing kind of narration.

As I said in the opening piece, there might be someone who would've surely tried but I Googled and Google to get a reference point or to continue a pre-existing model/work but unfortunately could not even find one single document that had proper method to it.

As always, I appreciate the support on this platform when it comes to these types of things and surely this model could be further improved if (people who actually do this for a living, YES I AM TALKING TO YOU, THE INSANELY HIGHLY PAID sports journalists) folks collaborate and make this more accessible via mainstream media / publications.
 
While I like others greatly applaud the effort behind this thread. I would humbly request that the OP starts with key outcomes first before showing us the engine.
I am more curious to know what this analysis has thrown up vs. conventional wisdom based or the usual suspects?

I did try to go through it, but I lost interest one-third of the way. I am sure that's my failing.

The reason why I started with selection criteria and the vocabulary was so that 'the main course' i.e. page 3 (post 3) and onwards made sense to the readers. If you're well versed in metriculated analysis then I suggest you read from thereon.

However, I assumed that for the non-technical audience, it would be better for them to get a grasp on the terminologies used rather than deriving conclusions without prior information. That is not to demean them of their abilities rather than to make sure that the point put forth from in the compilation above is carried forward.

Also, what you have suggested is also quite true in itself, seeing a wall of text & technical jargon does seem a proper turn off however, I believe that is my inability to write coherently and concisely I guess :( ; Thank you for the feedback and taking the time to read and critque - Appreciate it bro !
 
I believe that is my inability to write coherently and concisely I guess :( ; Thank you for the feedback and taking the time to read and critque - Appreciate it bro !

I cant fault the coherence, as it is well written enough. But I would like to know the salient points though....
 
I cant fault the coherence, as it is well written enough. But I would like to know the salient points though....

For a start Figure, two on Page 3 (3rd Post) gives us this. This is the crux of the argument and then other arguments are further derivations from here onwards. You can then refer to the Appendix I and II for graphical representation.

1.JPG
 
For a start Figure, two on Page 3 (3rd Post) gives us this. This is the crux of the argument and then other arguments are further derivations from here onwards. You can then refer to the Appendix I and II for graphical representation.

View attachment 78146

Molte grazie
So what I gather from this is that (after disregarding the folks who dont deserve to be playing or are now too old) asif zakir, iftikhar ahmed, mohammad waqas, awais zia, saad ali, sohaib maqsood.
thats plenty of backup talent to work with.
 
Molte grazie
So what I gather from this is that (after disregarding the folks who dont deserve to be playing or are now too old) asif zakir, iftikhar ahmed, mohammad waqas, awais zia, saad ali, sohaib maqsood.
thats plenty of backup talent to work with.

Prego

Actually they shouldn't be the 'backup' talent (as per say), based on their numbers they should ideally be under a rotation policy for test selections and or other at least be a part of the group on standby so that there is some sort of competition for the test spots in the national team.

Asad, Babar and to an extent even Sarfraz has been slacking off as they subconsciously know their spots are a bit secure with the going of YK and Misbah. This thought process needs to be shed ASAP and what better way to do it than to loop in actual performance who might be a genuine threat to their places. This will increase massive competition among the peers.
 
This is a fantastic effort! I have to analyse the numbers in greater detail but the work put in is excellent. Kudos to you sir!
 
This is a fantastic effort! I have to analyse the numbers in greater detail but the work put in is excellent. Kudos to you sir!

It would be incredible to actually have other people go through these themselves who might be well versed in performance metrics. I would humbled to have such an interaction level tbh. Also, many thanks for the kind words.

I would recommend post #9 (right at the bottom) for you to check the below noted via which my work and the spreadsheet file is publically available for all to see. :)

Finally, I would like to hear opinions & relevant ideas on how to further make this entire progression model better and more accurate while for this very reason I am going to publicly share the spreadsheet file that I maintained all throughout – The link is here
 
Incredible analysis. Wow... posters like [MENTION=136079]ahmedwaqas92[/MENTION] make PP a great place.
 
Incredible analysis. Wow... posters like [MENTION=136079]ahmedwaqas92[/MENTION] make PP a great place.

Post of the century!!!

I'd highly recommend to go through the spreadsheet link that I've made available through post #9 (right at the end) and delve into it to just to fathom how much of talent we're loosing because our selection policies are just not embedded in science, reasoning and proper logic!

A lot of our first class selections are if the guy is 'fit' has a solid 'technique' and looks 'reassuring' or 'aggressive' on the crease. These subjective filters make quite difficult to narrow down the true capacity of players who might actually be good at......you know.....(Scoring runs), that actually make you win games.

Just for a small example, our #1, #2 and #4 test match regulars are 24th, 17th and (NOT ON THE FREAKING LIST) for the entire compilation - That should most certainly tell us where we might be going wrong in picking players for Red Ball Cricket.

In the end, I appreciate all the kind words & thank you for reading through that wall of text !
 
Back
Top