Imam’s been getting a lot of stick on this forum for his SR despite his AVG and I thought there should be a relative analysis of his performance against his peers in the top order. I believe Imam fits perfectly in the PCT because of PCT’s history of below par scores in ODIs. His role is to provide a solid foundation so PCT can score par scores and can compete/win on a consistent basis. I am ignoring the fact that Imam was the only centurion since Jan 2018 in PCT against the teams below.
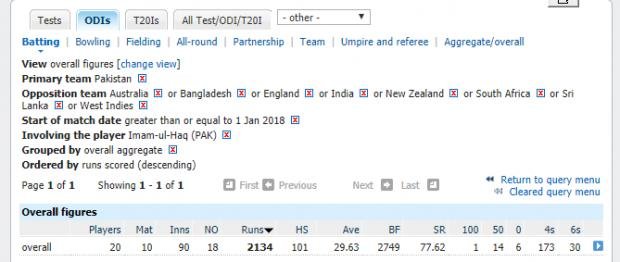
All these stats are since Jan 1st 2018. I removed stats against Zim, AFG, Ire and other associates as they are minnows. All the Averages and SR include only 8 teams (Aus, Ban, Ind, NZ, Pak, SA, SL, WI)
The following metrics were used to compare him to his peers. I believe these cover most of the facets of modern day top order ODI batting. Just AVG or SR don’t paint the complete picture. In fact they are downright misleading in some cases when teams don’t complete their complete quota of overs. For example in today’s game, Imam scored 71 at SR of 78.02. Fakhar scored 44 at 100 SR. The RRR was 3.3 and as long as the player’s SR was above the RRR, the total runs scored matter more than the SR.
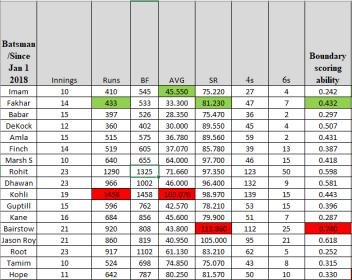
Green Highlighted cell indicates the best metric in PCT. Red highlighted cell indicates the best in the list
1) Boundary scoring ability: (4*Fours + 6*Sixes) / Balls Played
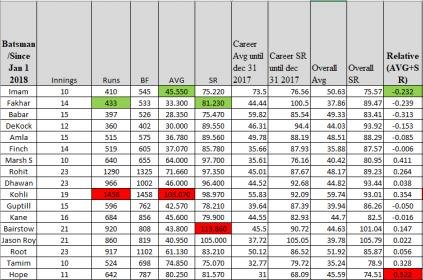
2) Relative (AVG+SR) = This metric is to see if the batsman progressed or regressed since 01/01/2018 compared to his overall stats . ((AVG+SR from Jan 2018)- (AVG+SR until Dec 2017))/ (Career AVG+SR)
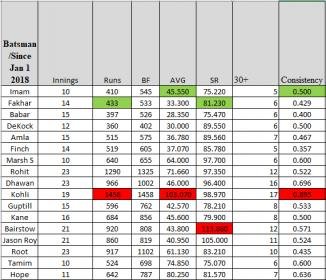
3) Consistency = No. of 30+ scores/total innings played. A low score consistently means the team is on the backfoot right away and will impact the RR and the momentum of the team.
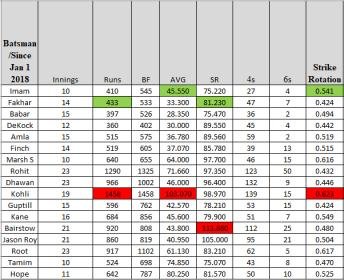
4) Strike Rotation = (Total Runs – (4*Fours + 6*Sixes))/(Total Balls Played – Boundary Balls)
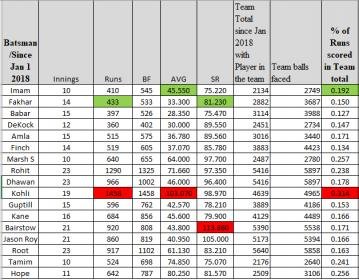
5) % of Runs Scored in Team Total: (Runs scored by the player/Team total runs scored when that player played in the team)
Top order batsmen are expected to score bulk of the runs. An average of all the batsmen in the list comes to 19 percent.
Example:
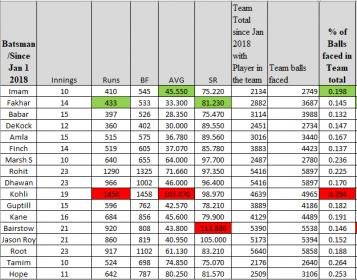
6) % of Balls faced in Team total: (BF by the player/Total BF by the team when the player played in the team). Top order batsmen are expected to face bulk of the deliveries and play long innings. Lesser number of deliveries played doesn’t mean success unless the batsman scores more than the peer average. The peer BF % average is 19%.
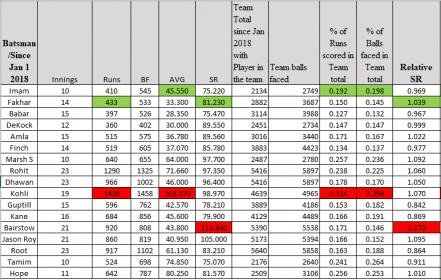
7) Relative Strike Rate: (% of runs scored in the team total runs) / (% of balls consumed in team total BF)
Example: Imam scores 19.2% of the total team runs and consumes 19.8% total deliveries faced by the team. The peer average is 19% for runs scored and 19% for balls consumed. He beats the peer average in scoring but consumes slightly higher number of deliveries. His effective strike rate is an accurate measurement of his impact than his regular SR.
8) Overall score is the sum of all the metrics
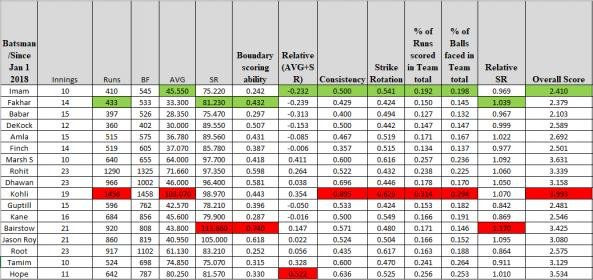
All these stats are since Jan 1st 2018. I removed stats against Zim, AFG, Ire and other associates as they are minnows. All the Averages and SR include only 8 teams (Aus, Ban, Ind, NZ, Pak, SA, SL, WI)
The following metrics were used to compare him to his peers. I believe these cover most of the facets of modern day top order ODI batting. Just AVG or SR don’t paint the complete picture. In fact they are downright misleading in some cases when teams don’t complete their complete quota of overs. For example in today’s game, Imam scored 71 at SR of 78.02. Fakhar scored 44 at 100 SR. The RRR was 3.3 and as long as the player’s SR was above the RRR, the total runs scored matter more than the SR.
Green Highlighted cell indicates the best metric in PCT. Red highlighted cell indicates the best in the list
1) Boundary scoring ability: (4*Fours + 6*Sixes) / Balls Played

2) Relative (AVG+SR) = This metric is to see if the batsman progressed or regressed since 01/01/2018 compared to his overall stats . ((AVG+SR from Jan 2018)- (AVG+SR until Dec 2017))/ (Career AVG+SR)

3) Consistency = No. of 30+ scores/total innings played. A low score consistently means the team is on the backfoot right away and will impact the RR and the momentum of the team.

4) Strike Rotation = (Total Runs – (4*Fours + 6*Sixes))/(Total Balls Played – Boundary Balls)

5) % of Runs Scored in Team Total: (Runs scored by the player/Team total runs scored when that player played in the team)
Top order batsmen are expected to score bulk of the runs. An average of all the batsmen in the list comes to 19 percent.
Example:


6) % of Balls faced in Team total: (BF by the player/Total BF by the team when the player played in the team). Top order batsmen are expected to face bulk of the deliveries and play long innings. Lesser number of deliveries played doesn’t mean success unless the batsman scores more than the peer average. The peer BF % average is 19%.

7) Relative Strike Rate: (% of runs scored in the team total runs) / (% of balls consumed in team total BF)
Example: Imam scores 19.2% of the total team runs and consumes 19.8% total deliveries faced by the team. The peer average is 19% for runs scored and 19% for balls consumed. He beats the peer average in scoring but consumes slightly higher number of deliveries. His effective strike rate is an accurate measurement of his impact than his regular SR.

8) Overall score is the sum of all the metrics


