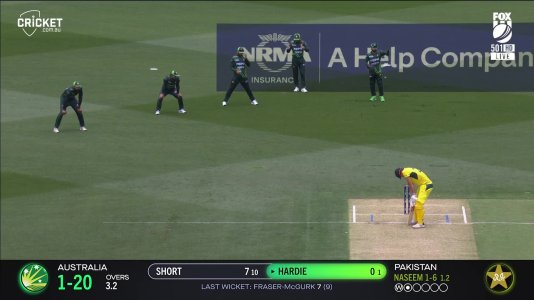
Australia is going to the dumpsters because it’s doing what people have been advocating Pakistan should do.
They have basically ignored their First Class performers and blooded one dimensional stroke makers from the BBL in ODI cricket and their (lack of) technique is getting exposed on early season spicy pitches.
Go and look at their top 20 Sheffield Shield run scorers last season and none of them are with this team.
Cricket is not 1 dimensional.
None of Australia’s top 10 FC and List A performers in this Aussie team and one can see the results.
Here are the top 10 run-scorers in Australia's domestic first-class cricket (Sheffield Shield) and List A cricket (Marsh One-Day Cup) for each of the past three seasons:
**Sheffield Shield (First-Class Cricket):**
2021–22 Season:
1. Peter Handscomb (Victoria) – 697 runs at an average of 49.79
2. Sam Whiteman (Western Australia) – 641 runs at an average of 58.27
3. Henry Hunt (South Australia) – 601 runs at an average of 42.93
4. Hilton Cartwright (Western Australia) – 601 runs at an average of 42.93
5. Tim Ward (Tasmania) – 552 runs at an average of 39.43
6. Nic Maddinson (Victoria) – 545 runs at an average of 54.50
7. Usman Khawaja (Queensland) – 529 runs at an average of 58.78
8. Jordan Silk (Tasmania) – 514 runs at an average of 57.11
9. Caleb Jewell (Tasmania) – 508 runs at an average of 36.29
10. Marnus Labuschagne (Queensland) – 507 runs at an average of 56.33
2022–23 Season:
1. Cameron Bancroft (Western Australia) – 945 runs at an average of 59.06
2. Daniel Drew (South Australia) – 656 runs at an average of 43.73
3. Caleb Jewell (Tasmania) – 652 runs at an average of 38.35
4. Peter Handscomb (Victoria) – 634 runs at an average of 70.44
5. Hilton Cartwright (Western Australia) – 629 runs at an average of 39.31
6. Matthew Short (Victoria) – 623 runs at an average of 41.53
7. Sam Whiteman (Western Australia) – 601 runs at an average of 31.63
8. Marcus Harris (Victoria) – 601 runs at an average of 37.56
9. Beau Webster (Tasmania) – 596 runs at an average of 42.57
10. Daniel Hughes (New South Wales) – 537 runs at an average of 38.36
2023–24 Season:
As of November 9, 2024, the 2023–24 Sheffield Shield season is ongoing, and complete statistics for top run-scorers are not yet finalized. For the most current information, please refer to official cricket statistics websites or the latest match reports.
**Marsh One-Day Cup (List A Cricket):**
2021–22 Season:
1. Josh Philippe (Western Australia) – 508 runs at an average of 72.57
2. Travis Head (South Australia) – 445 runs at an average of 74.16
3. Cameron Bancroft (Western Australia) – 337 runs at an average of 56.16
4. Marnus Labuschagne (Queensland) – 282 runs at an average of 56.40
5. Peter Handscomb (Victoria) – 275 runs at an average of 55.00
6. Daniel Hughes (New South Wales) – 270 runs at an average of 54.00
7. Sam Whiteman (Western Australia) – 265 runs at an average of 44.16
8. Jake Weatherald (South Australia) – 260 runs at an average of 43.33
9. Matthew Renshaw (Queensland) – 255 runs at an average of 42.50
10. Shaun Marsh (Western Australia) – 250 runs at an average of 50.00
2022–23 Season:
1. Daniel Hughes (New South Wales) – 548 runs at an average of 78.28
2. Josh Philippe (Western Australia) – 438 runs at an average of 62.57
3. Jake Doran (Tasmania) – 335 runs at an average of 83.75
4. Sam Whiteman (Western Australia) – 329 runs at an average of 54.83
5. Cameron Bancroft (Western Australia) – 320 runs at an average of 64.00
6. Peter Handscomb (Victoria) – 315 runs at an average of 52.50
7. Caleb Jewell (Tasmania) – 310 runs at an average of 51.66
8. Travis Head (South Australia) – 305 runs at an average of 50.83
9. Matthew Renshaw (Queensland) – 300 runs at an average of 50.00
10. Josh Inglis (Western Australia) – 295 runs at an average of 49.16
2023–24 Season:
As of November 9, 2024, the 2023–24 Marsh One-Day Cup season is ongoing, and complete statistics for top run-scorers are not yet finalized. For the most current information, please refer to official cricket statistics websites or the latest match reports.


 had a big contribution. This time Haris.
